Tutorials · Search and the map
The map
The whole city as outlines — ZIP codes, neighborhoods, census tracts, blocks and lots — each one opening its page, coloured by any figure your plan includes, with every building that has a figure marked on the map.
The map is the way to browse New York when you do not have an address yet. It draws the whole city as outlines: ZIP codes, neighborhoods, census tracts, tax blocks and lots. Point at a shape to see its name, and open it to go to its page. Browsing it is free and needs no account; colouring it by figures needs you to be signed in.
Getting there
Click Map in the bar at the top of any page. The map opens on the whole city, with ZIP codes outlined.
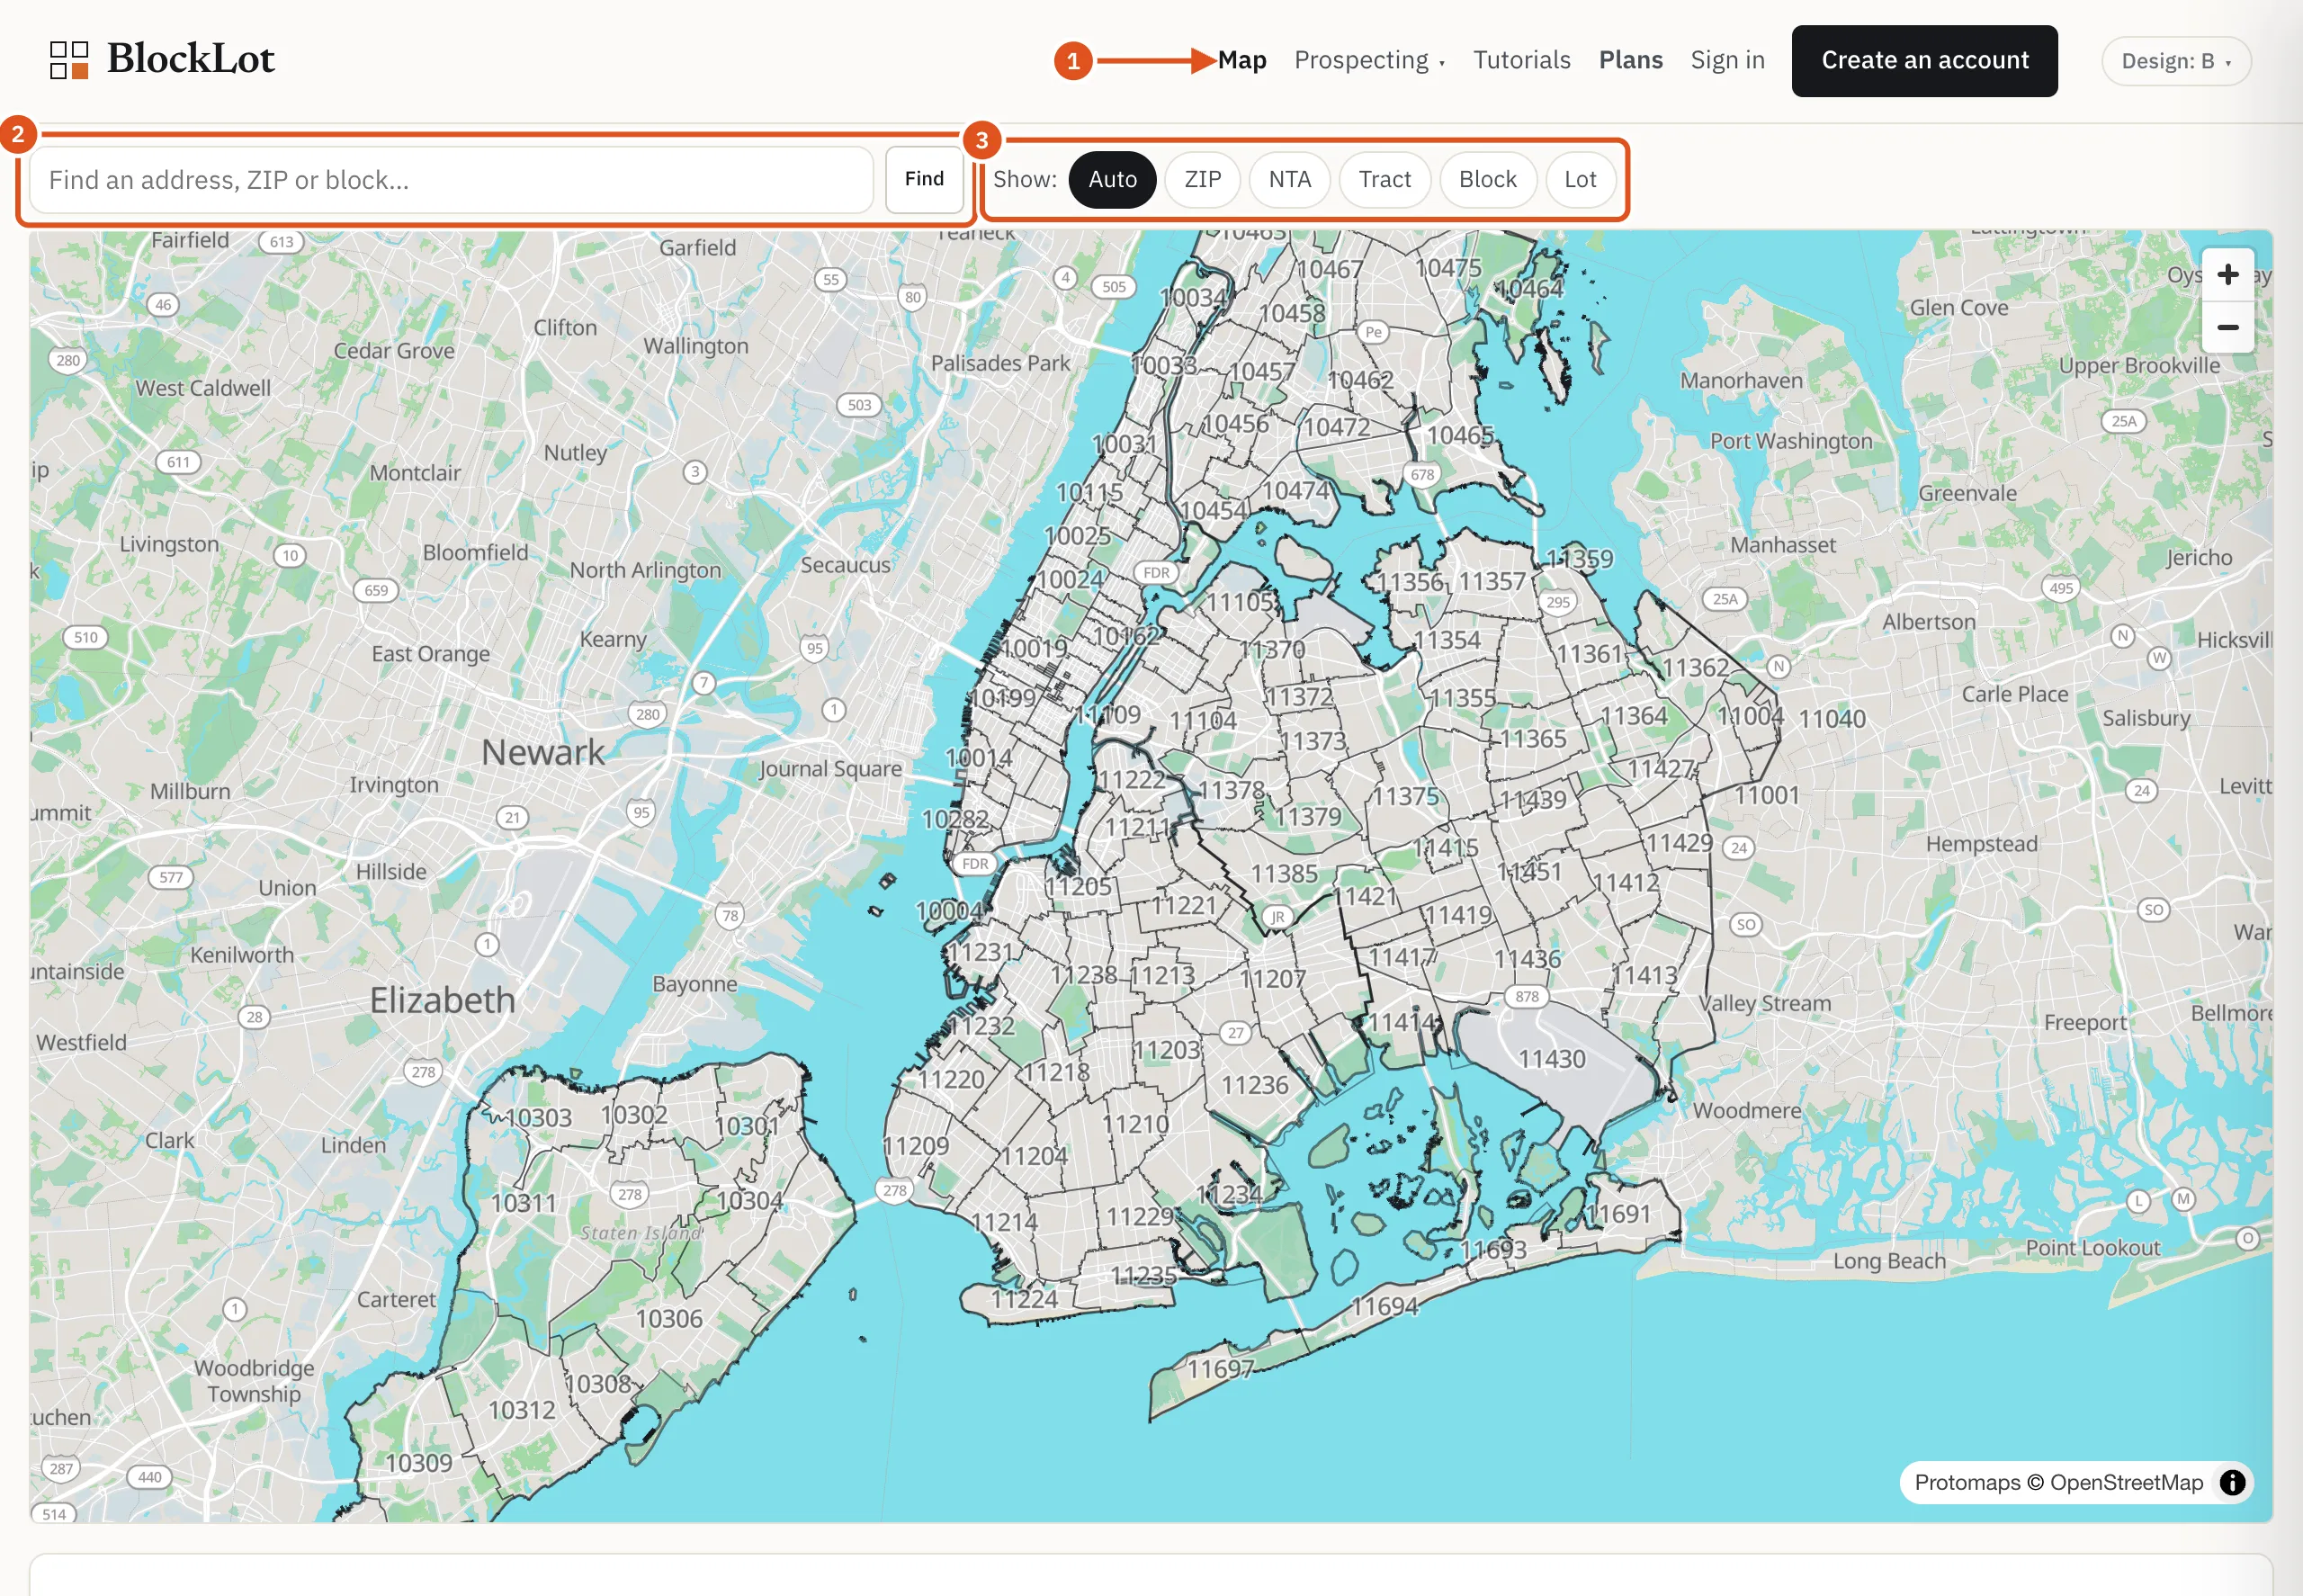
- Opens the map
- Jump to a place
- Choose what is outlined
Moving around
Drag to move and scroll or pinch to zoom. With Show: Auto, the outlines change as you zoom in: ZIP codes across the city, then census tracts, then blocks, then individual lots.
To hold one kind of outline, press its button after Show::
- ZIP: ZIP codes.
- NTA: neighborhoods, as the City's planners draw them (Neighborhood Tabulation Areas).
- Tract: census tracts, the small areas the Census counts by.
- Block: tax blocks. A tax block split by streets is drawn as its separate city blocks.
- Lot: tax lots, one per building or parcel.
Blocks and lots are small, so they appear only once you are zoomed in far enough. If you pick one of them while zoomed out, the map asks you to zoom in.
Borough lines are always drawn.
Finding a place
Type an address, a ZIP code or a block into Find an address, ZIP or block… and press Find. One match flies the map there; several are listed for you to choose from. The box finds places only, not owners or companies — use the search box for those.
Opening a shape
Point at a shape to outline it and see its name, such as a ZIP code, a census tract with its borough, a block number, or a lot's address. Click to open its page:
- a ZIP code opens its ZIP page;
- a neighborhood or a census tract opens its neighborhood or tract page;
- a block opens its block page;
- a lot opens its property page.
On a phone or tablet, the first tap shows the name with an Open → button, and a second tap on the same shape opens it.

- The shape you point at
- Its name — click to open
Colouring the map
Under the map, Show on the map lists every figure with two boxes: On map and Area. A figure is one or the other: ticking one box unticks the other. Area colours the areas, as this section describes; On map marks the buildings themselves (see Buildings on the map below).
Signed in, every Area box can be ticked. Tick as many as you like: the areas take the colour of the last one you ticked, marked ● colouring in the list. Every ticked figure also appears when you point at an area, one line each, in the order you ticked them.
- The chips above the legend, bottom left on the map, list what you have ticked. Click a chip to colour the map by that figure instead, without unticking anything.
- Untick the colouring figure and the colour passes to the one you ticked before it.
- The legend names the figure and says whether it shows a count or a rate, lists each shade with how many areas have it, and gives the date of the figures. Areas with none are left uncoloured. Hatched areas have no figure (for example, no priced sale in two years), or are too small to rate fairly.
- Each group of figures has its own colour — reds for distress and liens, blues for sales, oranges for commercial and so on — shown beside the group's name. A darker shade means more, not better or worse.
Counts and rates. Blocks show counts — how many open violations, how many lots on a tax-lien list — because on a block that is the number of buildings to look at. Census tracts, neighborhoods and ZIP codes show rates instead, such as the share of lots or open violations per 100 residential units, because a count on a large area mostly says how large it is. The As: buttons beside Show: switch between Count and Rate at any level; Auto goes back to the usual one. For totals such as floor area, units or market value, the rate is the average per lot. An area too small to rate fairly is hatched: a block with fewer than 10 lots (or 20 residential units, for a rate per unit), or a census tract, neighborhood or ZIP code with fewer than 25 lots (or 100 residential units).
Rises and falls. The change in market value on the year before can go either way, so it has two colours: oranges for falls and purples for rises, darker the larger the change, with areas that did not change left uncoloured. The legend runs from the largest fall to the largest rise.
How fresh the figures are. The legend gives the date the figures were worked out. For figures from a single city source, such as complaints or evictions, it also gives the date we last read that source.
Blocks across the whole city. Press Block after Show: while zoomed out to colour every block in the city at once.
The shades are worked out across the whole city for each kind of area, so a block keeps the same colour wherever you move the map, and a block looks the same on the map and on its ZIP page.
What your plan includes. Without an account the map shows outlines and names only, and the boxes in both columns are grey. With a free account you can colour by the figures any area page shows publicly — buildings, storefronts, permits, ownership kinds and more; the rest are greyed in both columns and marked not in your plan. A plan with a monthly report allowance colours by every figure, including after you have used this month's reports. Opening a page from the map counts as it does anywhere else; see Accounts and plans.
Lots, zoomed right in. At lot level, a figure that belongs to each building, such as its year built, its floor area, its open violations or whether an LLC owns it, colours the lots themselves. A figure that only exists for an area, such as a median price or a vacancy rate, leaves the colour on the block behind the lots. Where there are too many lots in view to colour one by one, the blocks keep the colour and the legend asks you to zoom in.
The map keeps what you have ticked, in both columns, and whether it shows counts or rates in the page's address too, so a view can be bookmarked or sent.
Buildings on the map
Tick On map beside a figure to mark every building that has it: every lot with a storefront, a tax lien, open violations, an LLC owner and so on. Each building is one mark, however many of the thing it has.
- Zoomed out, each building is a small dot in its group's colour.
- From street level, each dot becomes a round badge in the group's colour with the figure's own symbol. The symbol is shown beside the figure in the list, so the list is the key. The three distress bands share one symbol, darker for more severe.
- Several figures on one building show up to three badges side by side, then +2, +3 and so on for the rest.
- Zoomed in further, a badge shows how many there are when there is more than one, such as 5 storefronts.
- Point at a mark to see the building's address and the figures it carries.
Each ticked figure says how many buildings it marks in the current view, such as 312 in view. Common figures appear only from closer in, so the map never turns into a carpet of dots; until then the figure says zoom in to see it on the map. Some figures describe an area rather than a building, such as a median price or the number of owners, so their On map box is grey and marked area only.
The building card
Signed in, click a marked building, or any lot once you are zoomed in to lots, to open its card. It shows:
- the address and the building class;
- every figure you have ticked, in either column, for this building. A figure that only exists for an area gives the block's figure instead, and says so;
- the tax block it is on, or the city block when the tax block is split by streets;
- Street frontage, the buildings on both sides of its street;
- the intersections at each end of its block. A corner building lists the ends of both its streets;
- Open →, the building's property page.
The card itself is free. Opening the property page counts as it does anywhere else. Without an account there is no card: clicking a lot opens its page directly, as before.
Some ZIP codes along the city line belong to neighboring places. The map draws them and names them as outside New York City; they open nothing and are never coloured. A few ZIP codes that are a single building have figures but no outline; at ZIP level they are listed under the map.